Introduction to Mitrade Trading Platform
Understanding how to use your tools is just as important in knowing the in-and-outs of the financial market. Here we will look at the Mitrade platform and how to use it.
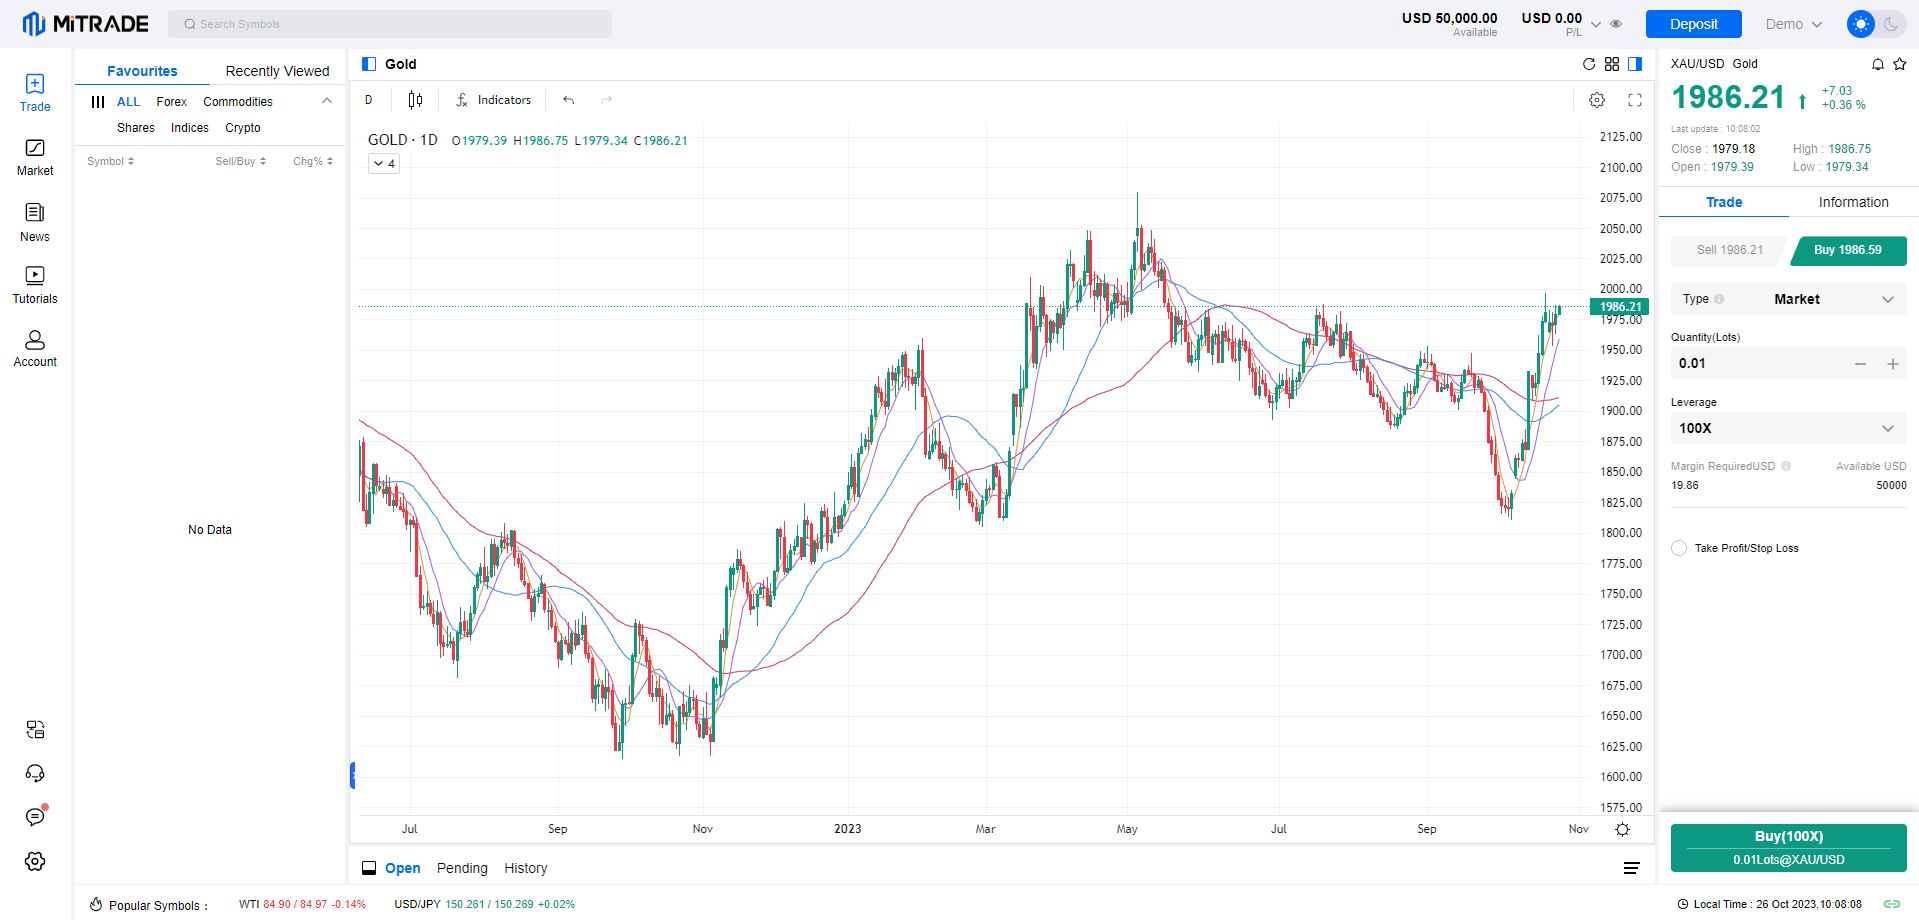
First Glance at the Web Trader

Trading Balances
Main Trading Window
Vertical Scale - Price Index
Symbols - Financial Instruments available to trade
Horizontal Scale - Date & Time
This is the overview of your financial health when trading.
P/L: The sum of unrealized profit/loss and overnight fees of all open positions
Equity: The current value of the account including profit/loss of all open positions.
Available: The available amount in the account to open new positions
Margin: The amount required to open and maintain all open positions.
Margin Level: Equity/Margin *100%
Mitrade carries numerous investment instruments for you to trade, from hundreds of Forex Pairs, Shares, Indices, Commodities, and Cryptocurrencies available for trading
This is where you see the current market movements, insert your preferred indicators, and draw your trade projections.
The display for the price index.
The current price will be highlighted.
Traders are able to adjust the scales by right-clicking on the vertical scale or using the gear icon on the bottom right.
The date & time for the trading chart.
With the Mitrade platform, you’re able to switch the horizontal scale to reflect your preferred timezone.
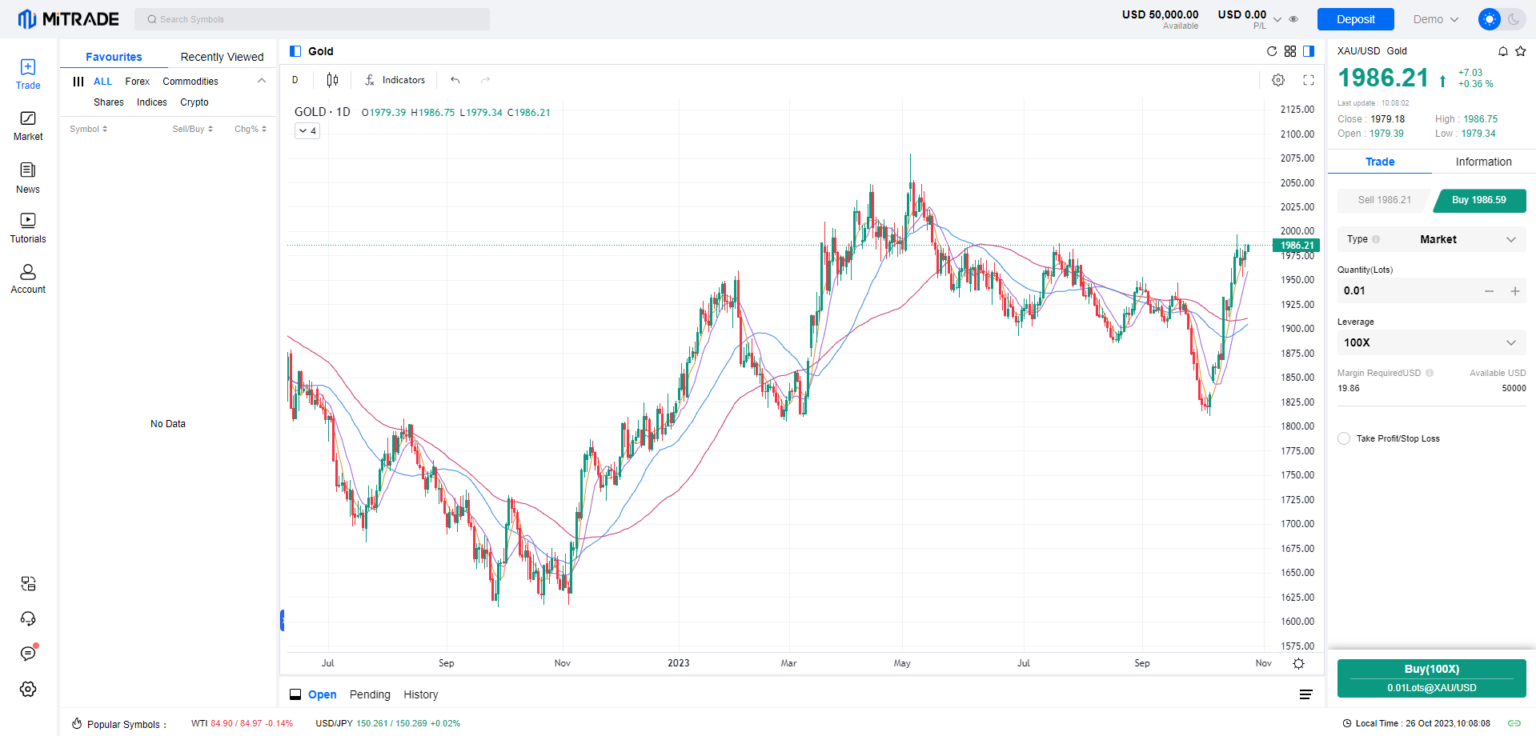
A more detailed view on the trading platform

Timeframes
Trading Charts
Indicators
Statistics of the Candle
This is the timeframe setting for the chart.
It represents the duration that data is compiled, between the opening and closing price
Example, when 15m is selected, each candle represents 15minutes of price movement.
When W (weekly) is selected, each candle represents the start of the week and the candle closes on the last day of the week.
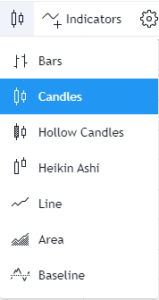
 | Bars : display the chart as a sequence of bars (transform into the bar chart). Candles: display the chart as a sequence of candlesticks (transform into the candlestick chart). Hollow Candles: similar to candles, but body of the bull candles are hollow (unshaded). Heikin Ashi: constructed similar to the regular candle stick chart, except the calculation for each bar is different. Line: display the chart as a line connecting the points of bar close prices (transform into line chart). Area: a graph that combines a line chart and a bar chart to show changes in the quantities over time. Baseline: a chart with a fixed point of reference that is used to compare prices that goes above or below the stipulated threshold. |

Indicators are statistical formulaes and calculations that aids the trader in predicting future price movements. These indicators can provide valuable insights allowing traders to formulate strategies around them. Some popular indicators include; Moving Average, Bollinger Bands, Relative Strength Index (RSI), and Moving average convergence divergence (MACD).

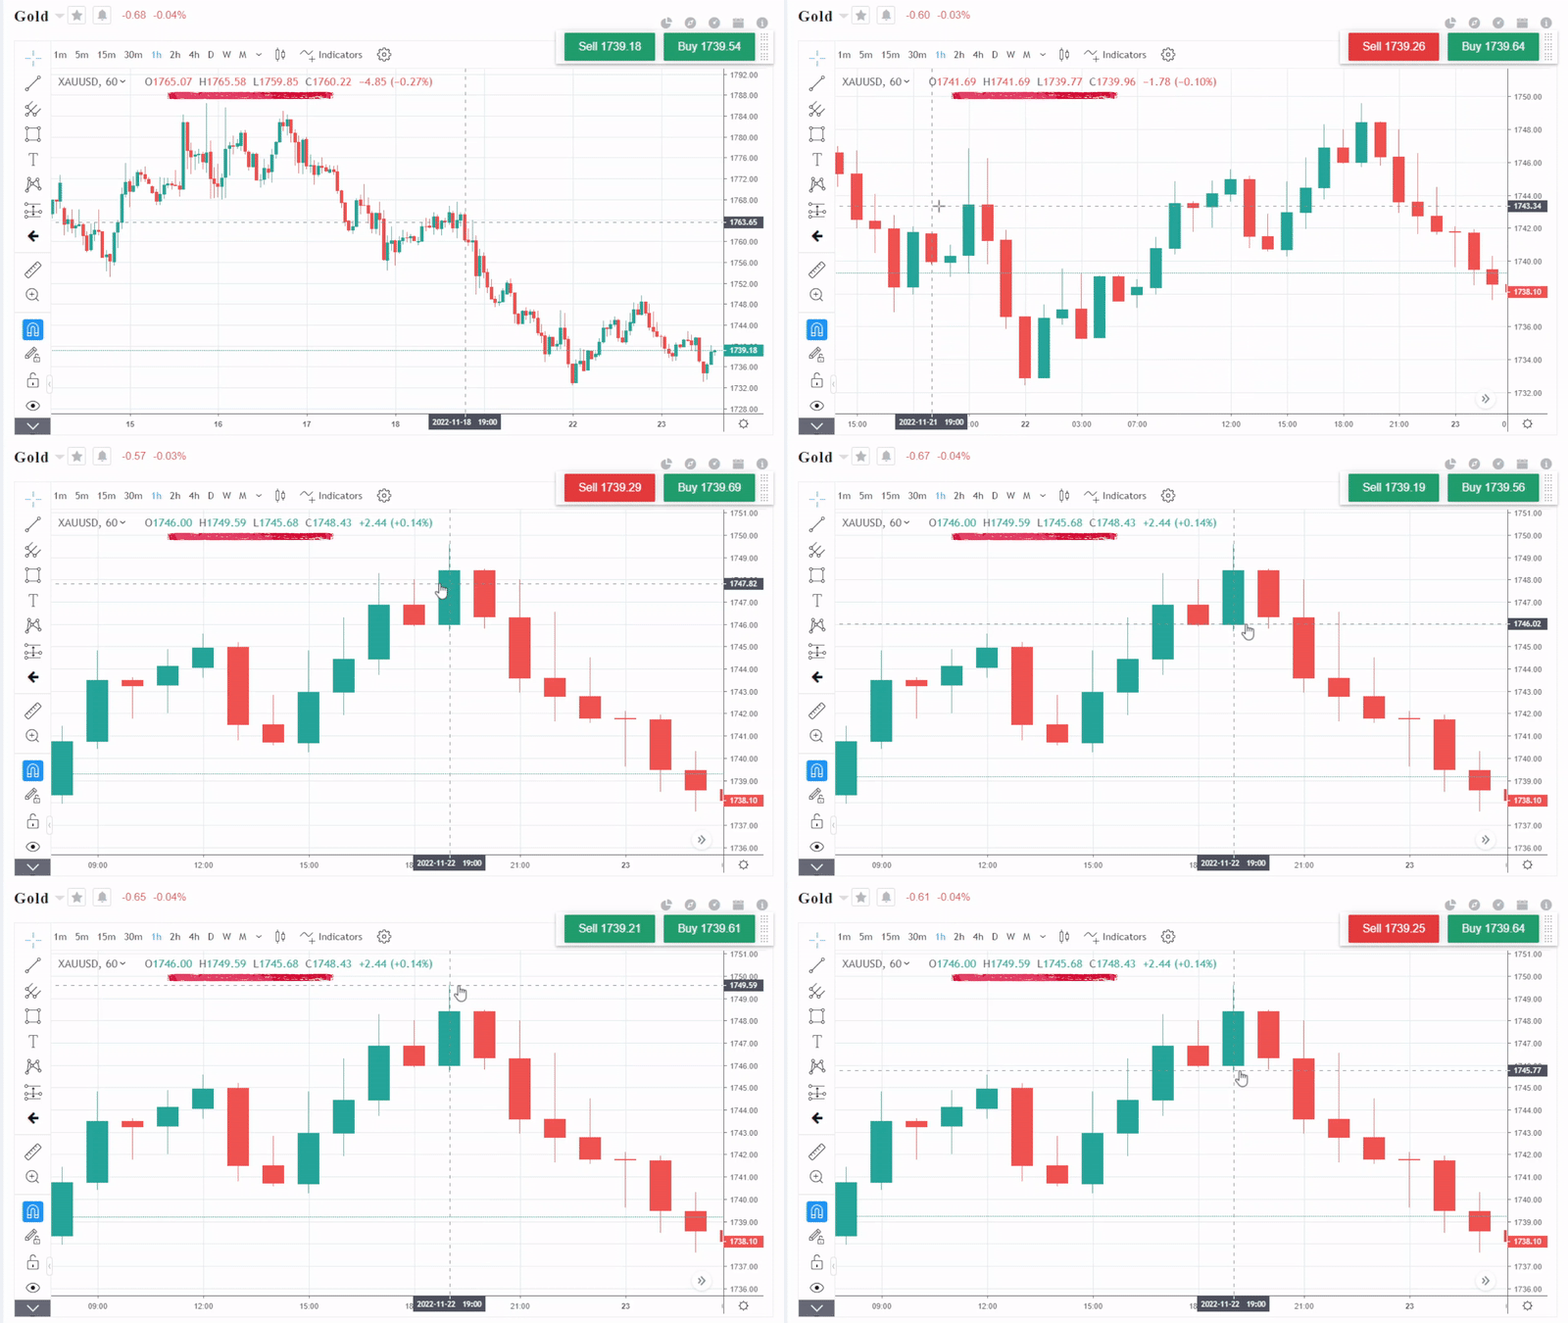
It displays the data (Open (O) | High (H) | Low (L) | Close (C) | Difference from previous candle close price | % change from previous candle close price) of the candle that the cursor is hovering over.
It is important to note that if you’re measuring the last or current candle, as the candle have yet to close, the values of the candle will still be updating.
Side Menu
Monitor your trades, deposit and withdraw funds, and account settings at the side menus.

Trade - Monitor the markets in real-time
Market -a customizable dashboard to monitor multiple markets at once
News - Stay connected to the market pulse with real-time news updates.
Tutorial - Head to Mitrade Academy for more trading guides and educational material
Account - Manage your Account Information, Account Statement, Security, Notifications, and Promotions
